Baobab
Ringschart is a graphical representation of the disk usage by a concrete folder. When launching the application, it is notified the usage of the file system as it can be seen in the next figure:
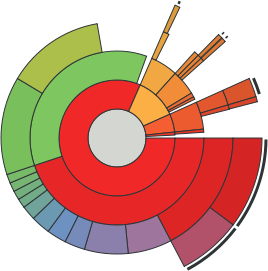
When you start scanning a folder, the tree of subfolders is created and listed on the left side. Each row contains information for the name, how much space it is taking up (percentage and size in KB, MB or GB) and the number of items (adding files and directories). When this process ends up, the Ringschart is drawn on the right side. If you stop it before it has been completed, only a partial representation is done based on the directories whose usage was computed.
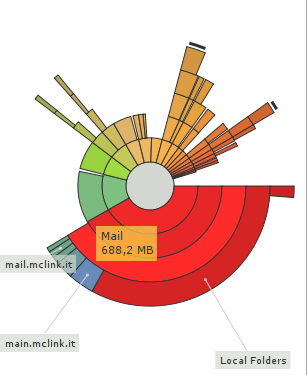
The Ringschart is composed of a set of nested rings around a central circle. This circle symbolizes the root folder of the partial tree (that is, the folder that the user has selected for scanning). Each ring represents a level in the partial tree, so i.e. the subfolders of the root folder will be represented in the first ring, and deeper levels in the tree correspond to outer rings in the chart. Each subfolder is represented by a sector of the ring, its angle being proportional to the size of the folder's contents, and painted with a different color to ease visualization. Up to five levels can be drawn; in case that a folder in that last fifth level contains even more subfolders, this situation will be pointed by the presence of a black curve close to the edge of that folder's ring sector. When a folder with no further subfolders is selected to be the root of the partial tree, only the inner circle will be drawn. When the mouse pointer hovers one of the folders in the graphic, it will be highlighted and a tooltip will appears with information about its name and size. If there are any subfolders, small grey tooltips will appear, indicating their names. It's possible that not all of the subfolders' names are displayed, to avoid overlappings.
You can go up and down the rows in the list (optionally expanding those with subfolders), the graphic representation will change using the selected folder as the root of the partial tree to be represented. The folders can also be navigated from the ringschart itself. If you click with the left button of your mouse inside a folder, you'll move deeper by setting the root of the graphic to that folder. If you press the middle button (no matter the place as long as you click inside the ringschart frame) you'll get the opposite behaviour, going back one step in the hierarchy.
The percentage of its parent's radius that is used by a given folder is directly proportional to the relation between it's own size and its parent's. It's easy to understand that the size of a folder is equal or smaller than its parent's. Although only directories are shown in this graphical representation, files are taken into account to calculate the amount of space occupied by folders.
 |
||
| Treemaps |

|